Source: http://support.sas.com/documentation/cdl/en/statug/63033/HTML/default/statug_boxplot_sect031.htm
Direct link to map: http://support.sas.com/documentation/cdl/en/statug/63033/HTML/default/images/ex6bout.png
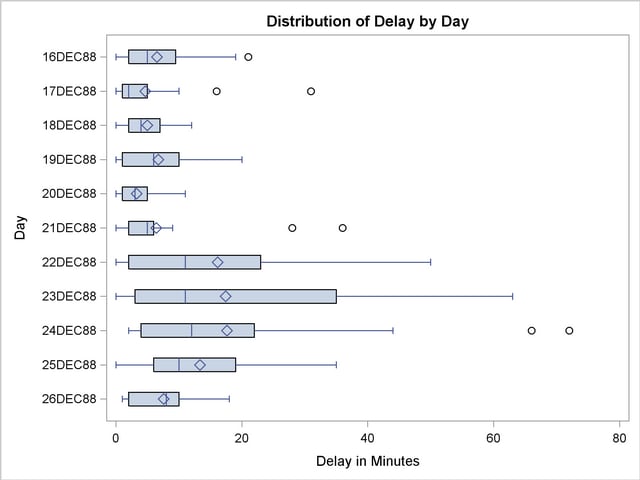
Box plots, also known as box-and-wisker diagrams, are useful in comparing multiple sets of data because they display the median, the average, and the level or measurement of dispersion. This box plot depicts the distribution of flight delays by date.
No comments:
Post a Comment