Direct link to map: http://climate.uvic.ca/people/ewiebe/car/gas_price.png
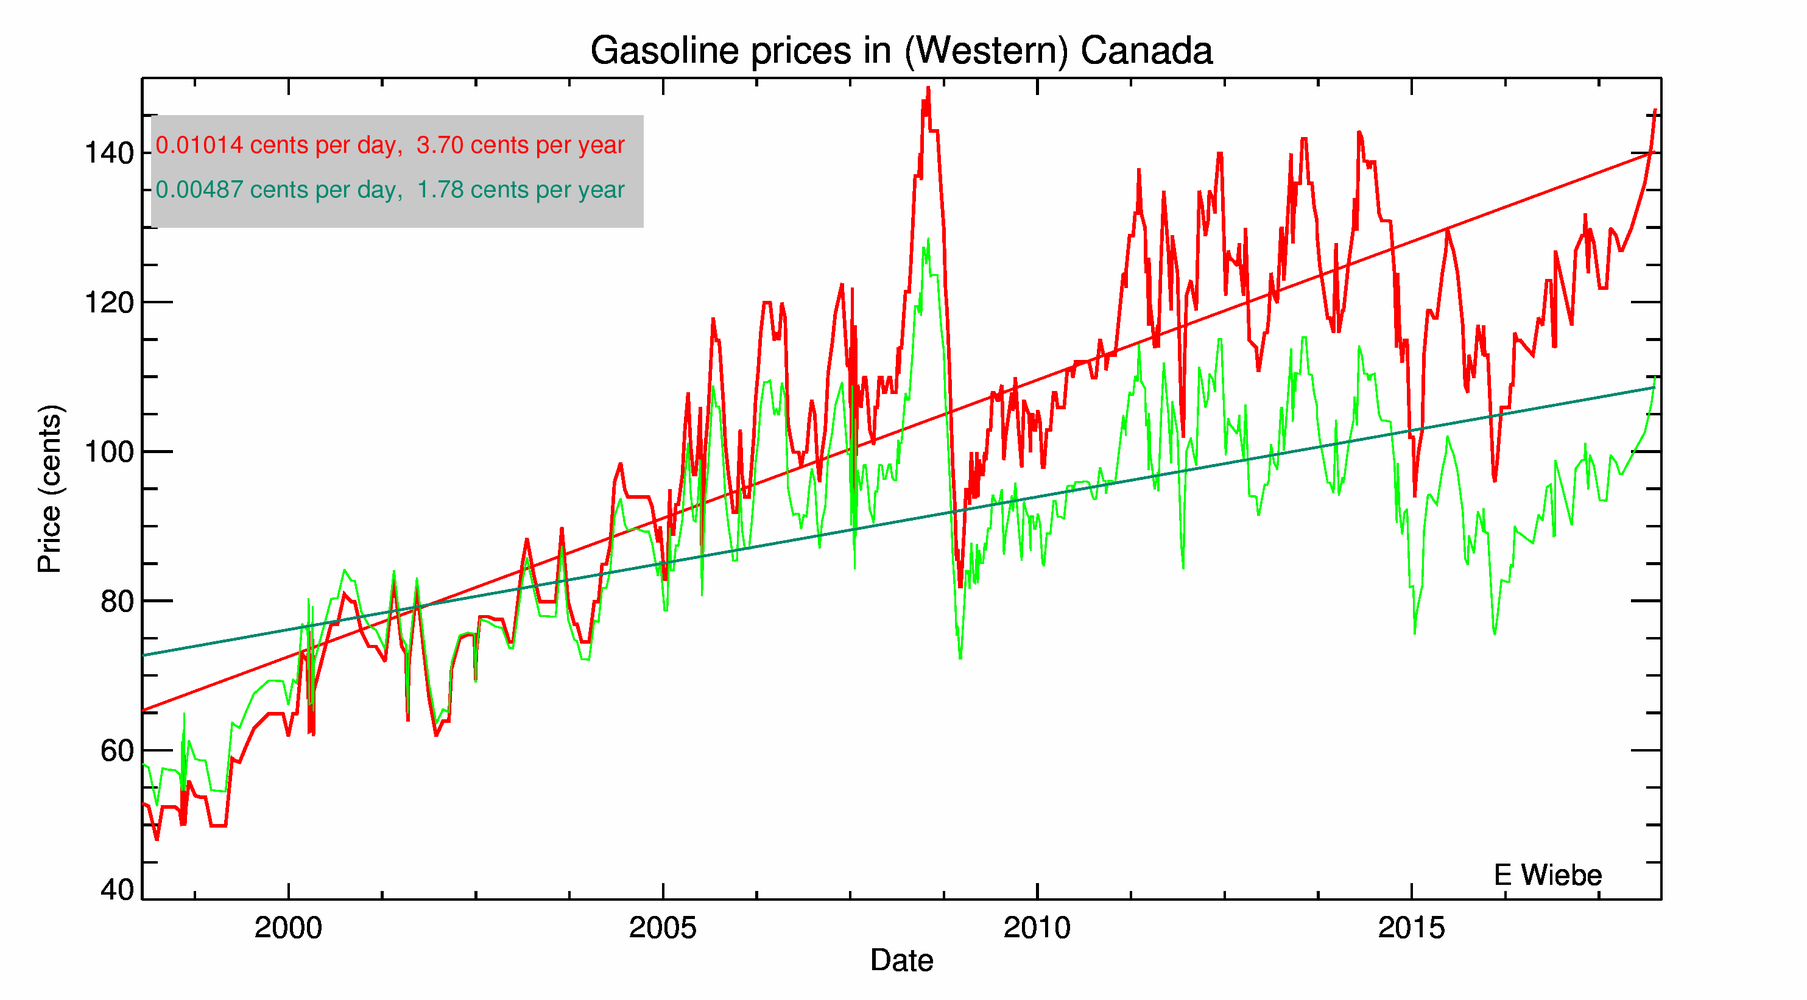
In an index value plot, an index value is plotted instead of an actual number. An index value, not an absolute value, is plotted on a line graph. This graph shows the gasoline prices in parts of Canada between 1998 and 2009
No comments:
Post a Comment